Weather Observation
Hardly ever works...
Having just survived the great heat wave of 2022 popping into the garden to look at a glass thermometer like some sort of caveman became far too much like hard work. So in preparation for the next sweltering day or freezing night I've acquired a mini weather station and being a geek have set it up to log to a database.
Recent Data
The following graphs show the last seven days of collected data.


Records
Possibly should have set this all up before the heatwave...
The table below shows the maximum and (where meaningful) the minimum recorded measurements logged.
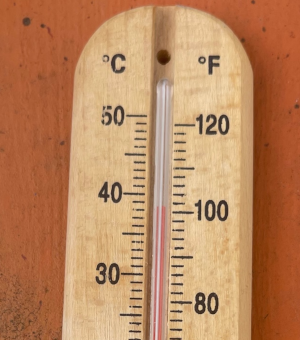 Temperature in the shade at 2pm on Tuesday the 19th of July 2022
| Type | Location | Measurement | Value | Date |
|---|
How it Works
The weather station is an Ecowitt WS2910 which has an outdoor unit talking to an indoor unit over radio. The indoor unit can connect to a few web-services to log data and handily you can give it your own URL to log against too. To keep the data "on-prem" I've got an InfluxDB instance with a very small Spring Boot app in-front of it which accepts the POST messages from the indoor unit and converts them into more modern units before logging them in an Influx bucket.
I should give Grafana's image export function a brief mention, it uses headless chromium to take a screenshot of the JS produced graph which seems incredibly Heath Robinson. Unfortunately neither InfluxDB nor Grafana have any great ways of sharing graphs without exposing the instance to internet traffic. So there's now a small Python script which queries InfluxDB and uses matplotlib to draw the graphs here which is just scheduled in cron.
I will post the code for both the Spring Boot application and the Python script to GitHub soon...